Liquidity Time Preference Markets (Shadow TVL)
Reimagining DeFi Liquidity Through Time. Decentralized Finance has largely measured its strength using one metric: Total Value Locked (TVL). Billions of dollars sit inside smart contracts, signaling capital commitment, protocol confidence, and market depth. But TVL has a hidden flaw: it ignores time.
A dollar locked for 5 minutes and a dollar locked for 5 years are treated the same.
This blind spot opens the door to a new primitive in DeFi design: Liquidity Time Preference Markets, also known as Shadow TVL.
The Problem With Traditional TVL
TVL answers one question:
“How much capital is inside a protocol right now?”
But DeFi users behave very differently depending on how long they intend to stay.
Consider three liquidity providers:
| Provider | Capital | Lock Duration |
|---|---|---|
| Trader A | $1M | 30 minutes |
| Yield Farmer B | $1M | 7 days |
| DAO Treasury C | $1M | 2 years |
Traditional TVL says:
TVL = $3M
But economically, these deposits are not equal. The DAO treasury provides structural stability, while Trader A provides temporary liquidity that could vanish instantly.
This creates the concept of Shadow TVL — a deeper metric that accounts for time-weighted liquidity commitment.
What is Shadow TVL?
Shadow TVL = Liquidity adjusted by time commitment.
Instead of measuring only how much capital is present, Shadow TVL measures:
How long is liquidity expected to remain
How stable is the capital base, actually?
The protocol’s real economic security
Example:
| Deposit | Amount | Lock Duration | Shadow Value |
|---|---|---|---|
| $1M | 1 hour | 0.0001 weight | |
| $1M | 30 days | 0.3 weight | |
| $1M | 2 years | 1.0 weight |
Even though TVL is $3M, Shadow TVL may only equal ~$1.3M in stable liquidity.
This reveals the true durability of a protocol’s liquidity base.
Introducing Liquidity Time Preference Markets
Rather than just measuring time preference, DeFi could trade it directly.
A Liquidity Time Preference Market allows participants to buy and sell liquidity commitment durations.
Participants could trade:
Short-term liquidity rights
Long-term liquidity guarantees
Liquidity futures contracts
Think of it like interest rate markets, but for capital patience.
How It Could Work
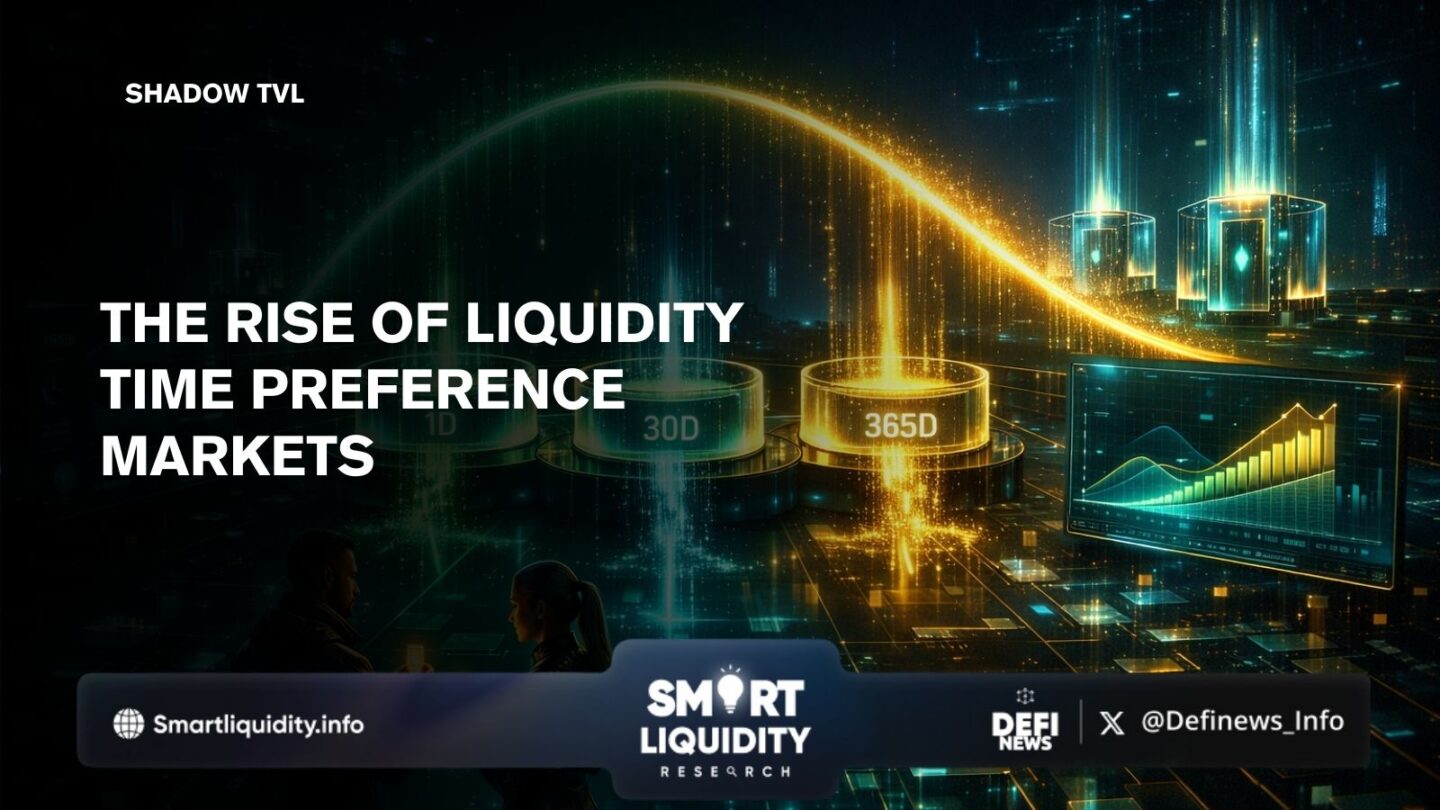
Step 1 — Liquidity Commitment Tokens
When depositing liquidity, users mint a token representing their lock duration.
Example tokens:
LQ-1D → Liquidity locked for 1 day
LQ-30D → Liquidity locked for 30 days
LQ-365D → Liquidity locked for 1 year
These tokens represent time-bound liquidity guarantees.
Step 2 — Secondary Markets
These liquidity commitments become tradable assets.
Traders could speculate on:
Liquidity shortages
Market volatility
Protocol stability
Example:
If traders expect high volatility next month, 30-day liquidity tokens become more valuable, because protocols will need deeper liquidity.
Step 3 — Shadow TVL Pricing
Protocols could use market prices of these tokens to compute Shadow TVL in real time.
Instead of:
TVL = $500M
Protocols would show:
Shadow TVL = $500M capital with 87-day average commitment
This creates a liquidity durability index.
Why This Changes DeFi Economics
1. Eliminates “Mercenary Liquidity.”
Yield farmers often chase incentives and exit instantly.
Liquidity Time Markets reward long-term capital commitment, reducing unstable liquidity.
2. New Derivatives Market
Liquidity duration becomes a financial asset.
Examples:
Liquidity futures
Liquidity volatility markets
Liquidity insurance
DeFi could develop a yield curve for liquidity similar to government bond markets.
3. Predictable Protocol Stability
Protocols could price risk based on how long liquidity is expected to remain.
A DEX with:
$100M TVL
180-day average liquidity commitment
is far more stable than one with $200M TVL but a 2-day commitment.
4. Capital Efficiency
DAOs and funds could optimize treasury deployment by selecting liquidity durations matching their risk profile.
Example:
| Strategy | Liquidity Duration |
|---|---|
| Arbitrage Funds | 1–3 days |
| Market Makers | 30–90 days |
| DAO Treasuries | 1–3 years |
Liquidity becomes programmable over time.
The Emergence of a Liquidity Yield Curve
Just like traditional finance has a bond yield curve, DeFi could develop a Liquidity Commitment Curve.
Example market rates:
| Duration | Expected Yield |
|---|---|
| 1 day | 2% APR |
| 30 days | 7% APR |
| 1 year | 18% APR |
This curve reflects market demand for liquidity stability.
During volatile markets, long-duration liquidity becomes extremely valuable.
Potential Use Cases
Stablecoin Defense
Stablecoin protocols could require a minimum liquidity duration for collateral pools.
This prevents bank-run style liquidity collapses.
MEV Protection
Validators and builders could secure blockspace liquidity guarantees, ensuring deep order books even during congestion.
DeFi Credit Markets
Lenders could issue loans backed by liquidity commitment tokens, turning liquidity guarantees into collateral.
Risks and Challenges
Despite its promise, Liquidity Time Preference Markets introduce new complexities:
Smart Contract Risk
Liquidity locks and tokenization increase protocol complexity.
Liquidity Fragmentation
Too many duration tokens could fragment capital across markets.
Speculation Loops
Traders might speculate heavily on liquidity scarcity.
However, these risks are similar to those seen in early interest rate derivatives markets in traditional finance.
Why This Idea Matters
DeFi’s biggest weakness is unstable liquidity.
TVL numbers can look impressive, but capital can disappear instantly.
Shadow TVL introduces a missing dimension: time.
Instead of measuring how much liquidity exists, DeFi could measure:
How committed is that liquidity actually?
Liquidity Time Preference Markets turn patience into a tradable financial primitive.
And once time becomes a market…
DeFi doesn’t just have liquidity.
It has predictable liquidity stability.